Our tools
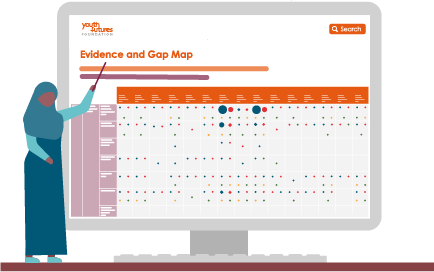
Evidence and Gap Map
The world’s largest interactive mapping resource for global evidence on what works to improve youth skills, employment and job quality.
As the national What Works Centre for youth employment, we want to make sure that support for young people is based on the best-available evidence
The map gathers global evidence on different types of intervention that are designed to improve youth employment outcomes and young people’s skills.
It indicates the quantity and strength of evidence, along with short summaries of the studies included and links to copies of the full text where this is available.
Outcomes are column headings along the top.
Intervention categories are listed as row headings down the left.
The contents of each cell are divided into bubbles according to:
The size of the ‘bubble’ is proportional to the number of studies.
The main categories are:
The map is interactive.
Clicking on a row or column heading gives the list of studies in that row or column.
Clicking on a cell gives the list of studies in that cell.
Clicking on a study record gives its bibliographic information, summary and a link to the original source.
Filters (top left) help you refine the records by:
If you have any questions, please contact our evidence team.
We will update the Evidence and Gap Map as new studies are published, including evaluations of Youth Futures funded interventions.
The map is designed to support evidence-informed decision-making by:
The map shows:
The map doesn’t show:
For this information, click through to an individual study report.

Our Director of Impact and Evidence introduces the digital tool, in conversation with Anna Smee and Campbell Collaboration’s CEO Howard White.