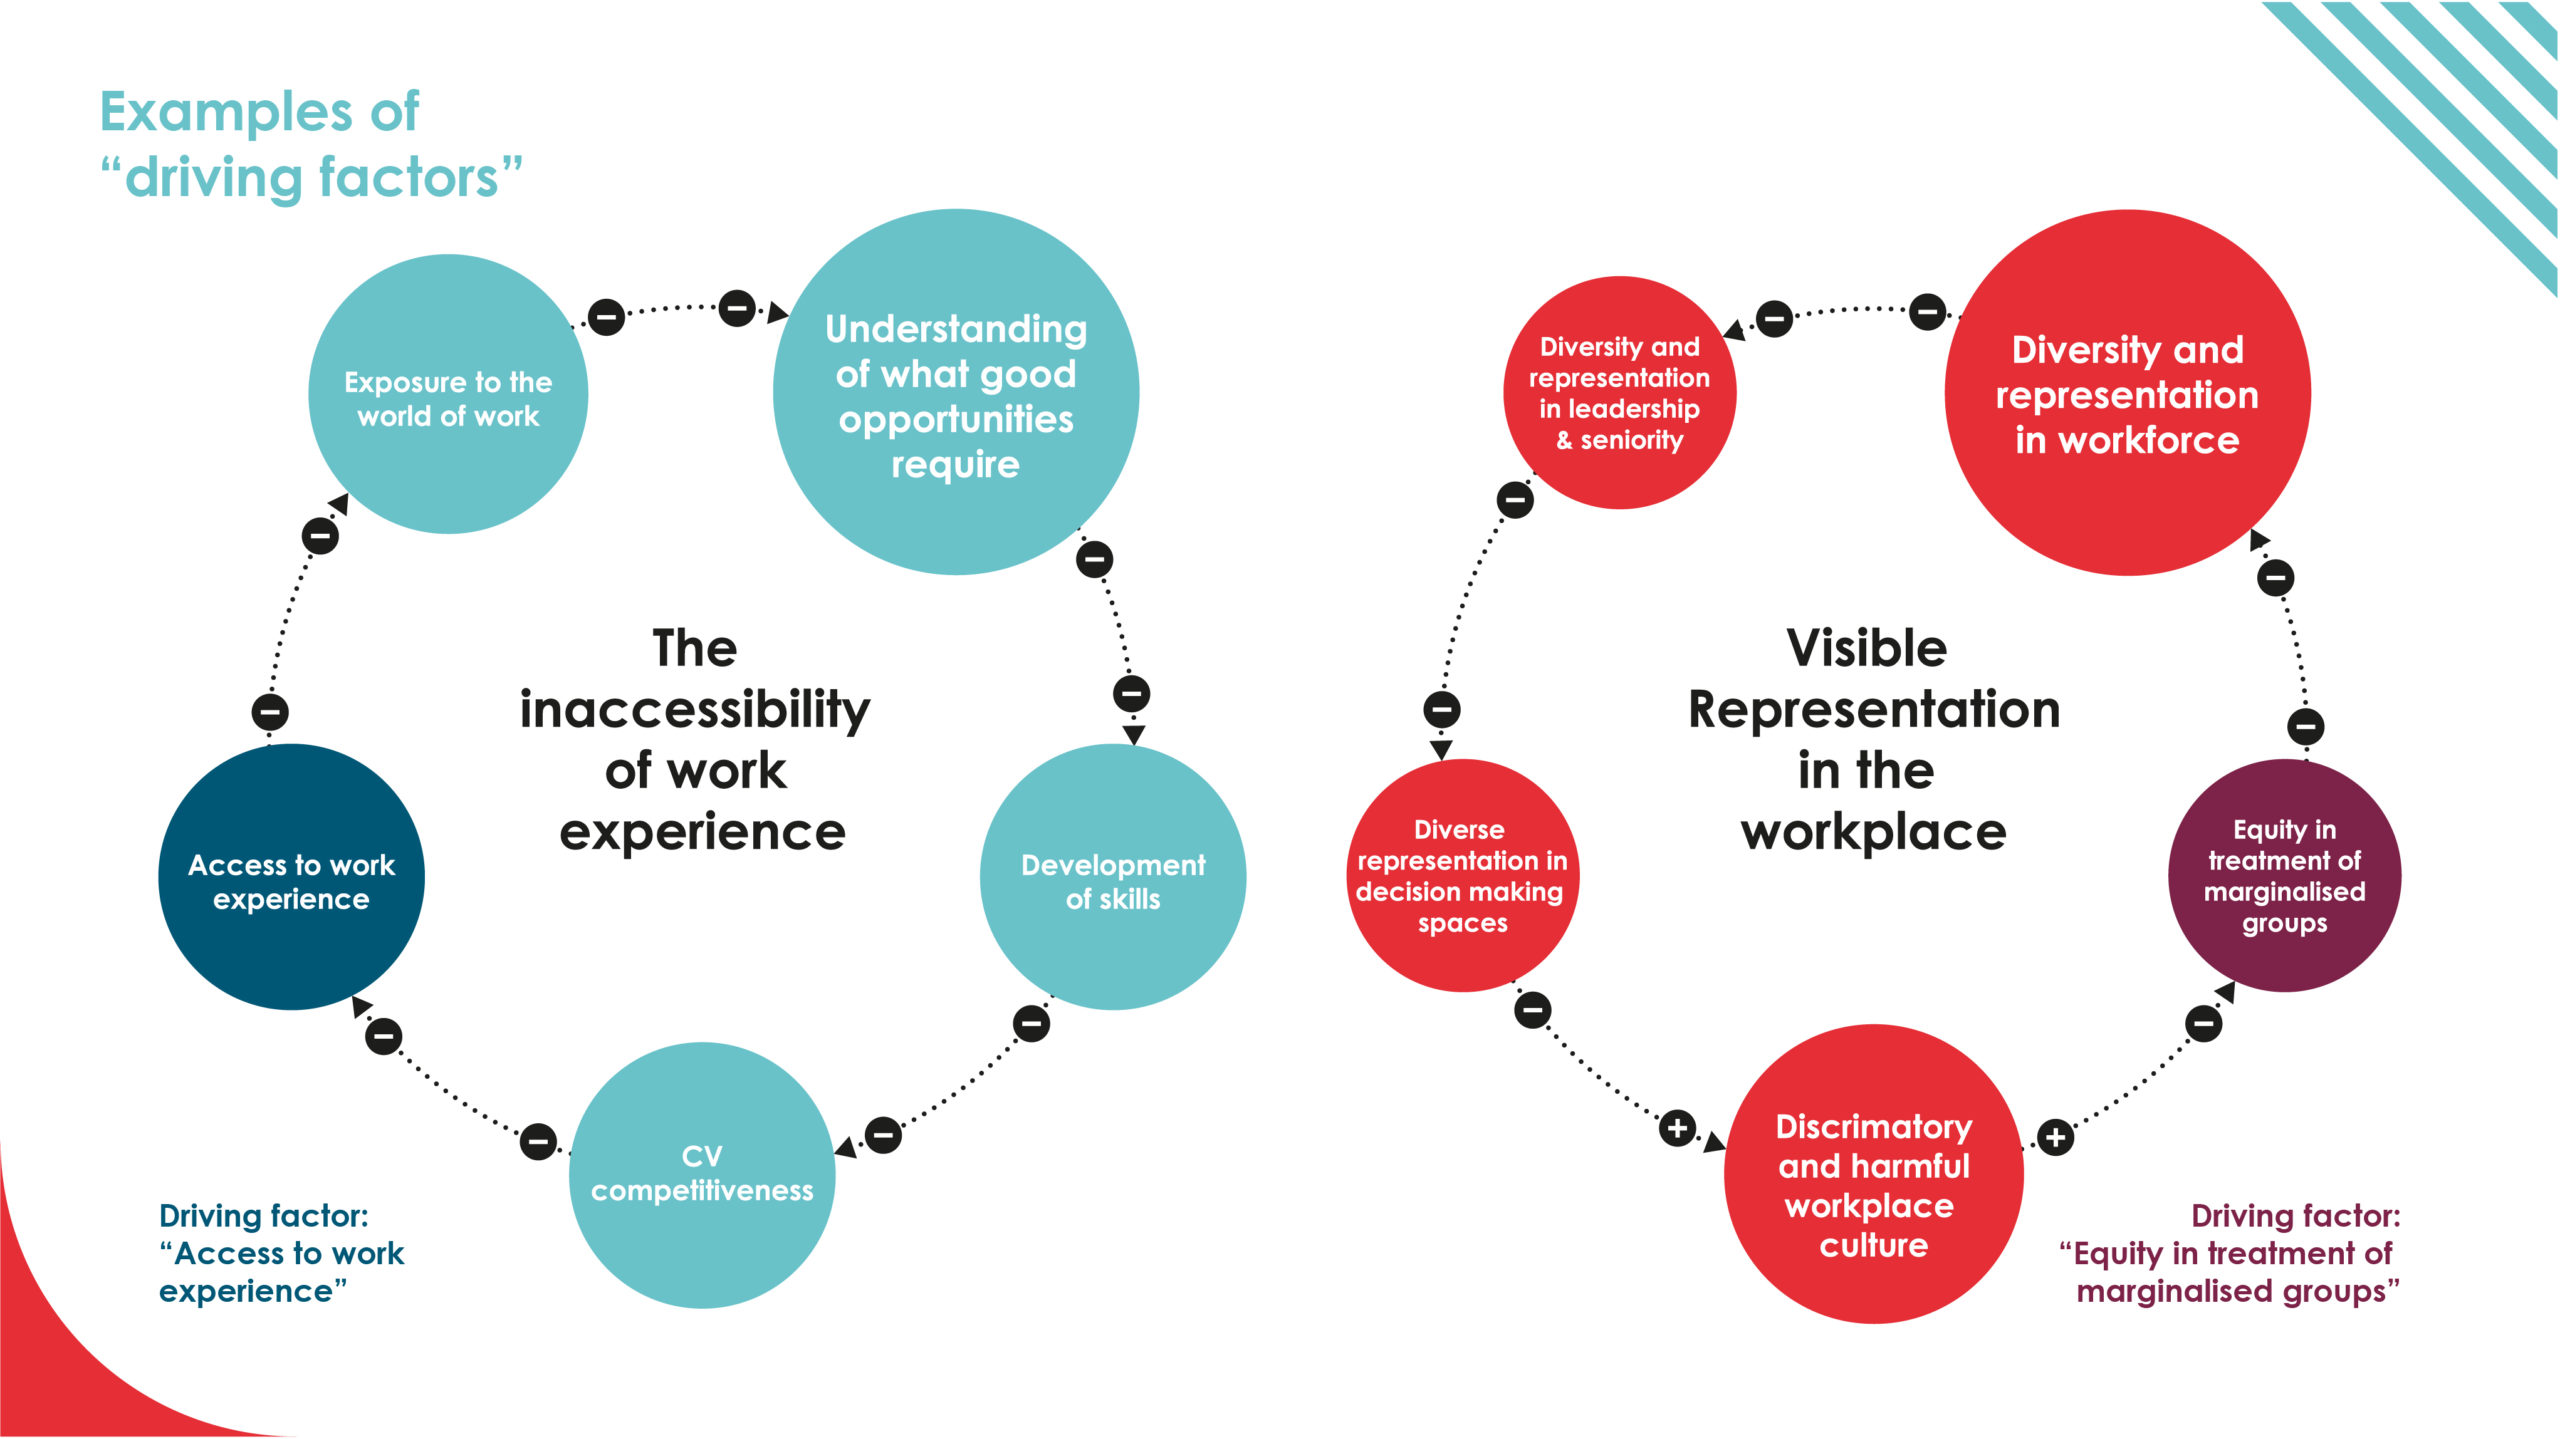
Youth Employment System Map

Our Youth Employment System Map

Welcome to our interactive Youth Employment System Map. Designed in 2021, it is the first attempt to map the youth employment system in England. It provides a visual representation of the barriers and opportunities young people from marginalised backgrounds face as they seek good jobs.

Our starting point was the experiences of three groups of young people who face disadvantage in the labour market and their journey through the system. The ‘common experience’ groups, engaged in 2021, are:


  • Young people with experience of the criminal justice system
  • Young people with experience of the care system
  • Young people of Pakistani or Bangladeshi heritage

Why we need a system map

To help young people from marginalised backgrounds get good jobs, we need to better understand and improve the way the youth employment “system” works. To do this, we need to collaborate with practitioners and employers, community representative and local leaders, social services, educators, careers advisors, research bodies and local and central government. Together, we want to understand:

  • Why the youth employment system is the way it is
  • What the driving forces behind unemployment for young people are
  • Which organisations, policies and institutions make up the system and how they relate to each other
  • Which issues are systemic and which require smaller-scale improvements
  • Where resources are deployed
  • Where we should focus our efforts, and where we should collaborate

How to use the system map

This interactive resource helps you to explore the complexity of youth employment, based on our latest research with young people and stakeholders.

If you haven’t used a system map before, please read this presentation for tips.

The map features six clusters representing issues identified by young people and stakeholders. They allow us to explore specific issues, whilst remaining interconnected across the system. We have produced two versions of the system map – our ‘interconnected’ version shows how our clusters connect across the system, whilst our ‘clustered’ version separates the themes we’ve found are core issues.

The map is made up of causal loops. These loops tell us a story about a part of the youth employment system. They and connect factors and identify the relationships between the factors – that is, what the consequence of an increase or decrease in one factor might be on the other.

When building each loop, we identified the factors driving the stories the loops tell us. These driving factors are a different colour to other factors and provide a good starting point to track the story behind each loop. Other important factors are those that connect to multiple others – these could be points where investment of resource could most improve outcomes for young people.

If you are interested in the issues raised by our ‘common experience’ groups of young people, select the group you’re interested in using the bar at the bottom of the map. This highlights the loops representing the important issues and experiences for that group.

The origin of the system map

Throughout summer 2021, we worked with the Social Change Agency to produce a first version of the map. It is based on feedback from:

  • Youth Futures’ Future Voices Group
  • Three ‘common experience’ groups of young people, representing the experience of groups facing significant and multiple barriers in their journey to employment
  • Over 40 stakeholders including funders, local and national policymakers, think-tanks, employers and practitioners

We chose six themes to guide these conversations:

  1. Education and skills system (secondary, further and higher education)
  2. Statutory and charity support services
  3. Individual and family circumstances and networks
  4. Workplaces (practices, attitudes and behaviours)
  5. Social inequalities, structures and discrimination
  6. The labour market

What the system map tells us

It represents the insights of young people and stakeholders involved so far. It is a rich but imperfect model; a version of the story that helps us understand the youth employment system. We will add more insights and evidence over time.

Young people’s perspectives are supported by findings from our research with stakeholders. The map helps all of us to see our position (as “system actors”) within the system, and how we can improve it. There are factors and relationships that are not included in the current version, and we hope to add more.

To identify points where you may have maximum influence, please consider:

  • Factors driving causal loops (the coloured factors)
  • Factors connecting to multiple other factors

Updates to the map

We plan to update the map gradually, with insights and expertise about key issues arising from the summer 2021 version. We will attach links to research and relevant articles to specific factors and loops.

How do I get involved?

Please get in touch if you would like to collaborate. We are interested in working with partners from across the system to test and develop the map. 

Please sign up to our newsletter for updates (below) and continue to feedback on the system map, including how it is supporting your work and any questions you might have.

Skip to content